NFL Over/Unders 2017-18

Forgot to publish this before the start of the season. I promise it’s untouched and I haven’t changed anything based on the first two weeks of the season. You can tell by the fact that I already know I’m going to be wrong on a lot of these.


Team Over/Under Jake
Arizona 8.5 Over
Atlanta 9.5 Over
Baltimore 8.5 Under
Buffalo 6.5 Under
Carolina 8.5 Under
Chicago 5.5 Under
Cincinnati 8.5 Over
Cleveland 4.5 Under
Dallas 9.5 Under
Denver 8.5 Under
Detroit 7.5 Under
Green Bay 10.5 Over
Houston 8.5 Over
Indianapolis 8.5 Under
Jacksonville 6.5 Under
Kansas City 9 Over
LA Chargers 7.5 Over
LA Rams 5.5 Under
Miami 7.5 Under
Minnesota 8.5 Over
New England 12.5 Over
New Orleans 8 Over
New York Giants 9 Under
New York Jets 4.5 Under
Oakland 9.5 Over
Philadelphia 8.5 Over
Pittsburgh 10.5 Over
San Francisco 4.5 Under
Seattle 10.5 Over
Tampa Bay 8.5 Over
Tennessee 8.5 Over
Washington 7.5 Over
Standard

In For A Knut, In For A Galleon

A weird pet project I’ve been wanting to pursue for a while: figure out how much 1 Galleon is in GBP.
I made a whole spreadsheet of every instance of when a specific price was assigned to a product or service. A slight issue is that the majority are “magic only” type products…a wand costs 7 galleons and obviously there’s no frame of reference for us muggles. The best products to base it off are: hot chocolate on the Knight Bus (an extra 2 sickles on top of the 11 sickle journey) and Butterbeers ordered in the Hog’s Head (3 = 6 sickles, so 2 sickles a beer).
So a hot chocolate and a butterbeer cost roughly the same which leads me to estimate that one sickle is probably worth about £1. This makes sense to me: hot choc might be a bit pricey at £2 but this is a drink bought on a bus/train/other mode of transport where goods are typically marked up and priced higher. £2 for a butterbeer might be cheap but this is 1) 1995 when a pint was roughly £2-2.50, 2) bought at the grimey Hog’s Head where presumably drinks are cheaper to fit with their clientele, 3) butterbeer is low alcohol/non-alcoholic so would probably be slightly cheaper than a regular Hagrid mug of mead. Its also possible that its not a pint as it typically comes in bottles, so again, this would contribute to a slightly lower price point.
Given that there are 29 Knuts in a Sickle and 17 Sickles in a Galleon (“it’s easy enough”), this works out to:
1 Knut = 3p
1 Sickle = £1
1 Galleon = £17
What does this mean for some of the more interesting prices of goods we see throughout the books?
Wand = £119 – seems kind of reasonable that a wand would be expensive but affordable.
Harry Spends approximately £11.24 on candy on the Hogwarts Express. Greedy.
The Weasleys had one galleon and a ‘small pile’ of sickles in their vault in Book 2. Being generous and estimating that they had 25 sickles, would mean they had about £42 in there…they really are poor.
However, then they go ahead and win the lottery of £11,900! Sounds about enough to pay for a trip to Egypt for the whole family.
Fred and George bet £644.10 on the Quidditch World Cup, no wonder they were trying to blackmail Ludo into giving them their winnings. Don’t know what the odds were but seems like it would be in the thousands of pounds.
Some guy in the woods tries to impress a veela by claiming to be a Dragon Killer earning 100 Galleons a year. He might want to get a better job because that’s only a £1,700 salary, low for even 1995! Further, Dumbledore (in the same book) offers Dobby a salary of 10 galleons a week (520 galleons per year), meaning you can earn more scrubbing plates and prepping food at Hogwarts than you can killing dragons – £8,840. And he probably gets food and accommodation thrown in. Maybe the dragon killer forgot to mention danger pay? Dobby took less money because he still enjoys work and got a yearly £884 stipend instead.
Triwizard winnings were £17,000, enough to get a joke shop off the ground I should think.
Weirdly, the price of a Daily Prophet declines from 5 knuts (17p) in Philosopher’s Stone to just 1 knut (3p) in Order of the Phoenix. Perhaps Hagrid has a premium service and/or Hermione gets a student discount?
Advanced Potion Making is priced at £153!
Reward on Harry Potter by book 7 is 200,000 galleons according to the Snatchers, £3.4mn. No wonder Pansy Parkinson wanted to turn him over.
Aside from those salary figures and a few other quirks (Harry spent over £500 on omnioculars!), this all seems fairly accurate to me.
That being said, JK Rowling actually said in an interview that £1 = 5 galleons. Which I don’t believe is actually that accurate. Dragon Killer would make just £500 a year! And a butterbeer/hot chocolate would be like 40p. Seems a little off.
Because I love her so much, I decided to defend her. She gave this particular interview in March 2001, and did mention that the value fluctuates. Thus I’ll assume that in 2001, £1 = 5 galleons and that’s because the wizarding currency appreciated in value massively (a change of -70.6% since 1995), following the downfall of YKW. Money started flowing in from muggle investors and overseas wizards (who use different currencies) who are aware of the Wizarding World as suddenly the political and economic climate stabilised now that the greatest Dark Wizard of all time had been defeated. So there you have it.
Standard

Rule Changes I Prepared Data For That Never Happened Wasting Probably 15 Hours Of My Life

Just before the start of our baseball Keeper league draft, our Commissioner proposed adding a new category for the season, called Runs Created. We’re also adding Holds as a pitching category but we can’t perform this exercise with that. I prepared a whole analysis explaining why it would be a not-so-great idea to add this particular stat, with my intention to lobby for Batter Ks instead. However, in the time it took to prepare this, the league decided against it and went with Total Bases as a category instead, which meant the amount of time I spent on this was all a waste. Oh well.

Using the fairly limited resources at my disposal, I tried my best to replicate the previous season with the addition of a Runs Created and a Batters Ks statistic. The challenge is that no team uses a roster of 20 batters only throughout the year but constantly brings in new players who contribute their stats for 1-159 games and all this must be accounted for. ESPN doesn’t provide a list of how many K’s or doubles or triples your team had last year, which obviously would make the process that much easier. It does provide the end of year stats for individual players and how many games/ABs they contributed towards your team score.

So for Runs Created, I used the ABs a player contributed to your specific team x their 2016 OBP and their 2016 SLG and added it to .55 of their SBs, which is about as close as we can get. This has the obvious limitations of not accounting for if you played Chris Davis for 20 ABs and he went 20/20 in your lineup or 0/20, it just uses his final averages for the year for those 20 ABs. Not much I can do about that.   

So here is what roughly the total Runs Created would have looked like for each of the teams in our league last year:

1RCs

As you can see from the chart above, the top 4 finishing teams in the league last year (CQB, OOB, AoN and BB) all finished in the top 4 in Runs Created. My 1st place team, also finished 1st in creating runs. I suppose its not a massive surprise that the best teams finished with the better Runs Created score. If we remove all the pitching categories from our final score to get a “Offense Only” score total (adding up the score for the 5 categories), it looks fairly similar to the Runs Created stat:

2Offense

What am I trying to say here? Essentially that the addition of Runs Created would largely reinforce the scores of teams who already have good offenses and punish those without, widening the gap between the top 4 teams and the rest of the league. My batters consist of Trout, Machado, Rizzo, Lindor, JD Martinez, Myers, Chris Davis and a whole lot more, so I’m likely to continue reaping the benefits of a system that rewards a Runs Created batting category. There’s a lot of overlap with existing categories and it wouldn’t do a lot to shake things up as you can see from the chart below, which shows the original final scores with the addition of the RC category on top. The major difference is that SWFL overtakes TQM for the 5th spot.

3RCsTotal

What I looked at as an alternative is adding a Ks category for batting. Every time one of your guys strikes out, he gets a K and the person with the most Ks gets the lowest score (1) while teams who strike out less get higher scores.

Again, ESPN doesn’t provide a Ks total for your specific team so I had to do some creative calculations to get a rough approximation. I used the At Bats of every player who ever swung for your team, divided by their total At Bats for the season to create a percentage of how much they contributed. I then multiplied their total Ks for the year by this percentage to get a rough estimate of how many Ks they contributed to your team. Adding up all those estimated Ks gives us the following totals.

4KABs

A bit more widespread than with the Runs Created but it does vaguely seem like the top teams have more Ks, then the middle bunch, then the last three teams with the least. As I mentioned before, the fact that the top 3 teams have the most Ks works as a benefit for the rest of the league as CQB gets 2 points, OOB gets 3 points and Attitude gets 1 point for this category, whereas teams like Boston gets the full 10 points and Future Proofers 8 points. This would actually help shake the final standings up a great deal:

5KABsTotal

From what I can tell, there isn’t a great deal of overlap between Ks and AVG, so it adds a new dynamic to the game.

The downside to this is that it does reward teams who may lose interest as the season goes on and don’t move active players into their lineups every day. It can make it impossible to get 10 points if one of the managers stops checking or doesn’t play as often.

Standard

Can’t go Over it, Can’t go Under it, Got to go Through it!

Congrats to this year’s Over/Under Champion: Joe
He narrowed a victory by correctly guessing 16, narrowly edging Alex and Sam (both with 15) and bringing up the rear myself and Martin with 14. Only a few predictions separating us all.
In the case of both Minnesota Vikings (8) and Denver Broncos (9), the final win total equalled exactly the preseason betting line, which counts as a push. I’ve just decided to score us all 0s for these two teams since in real life, money is just returned to all bettors.
Some of the interesting ‘out of consensus’ bets that paid off were:
– Martin taking the Over on the Cowboys
– Myself taking the Under on the Jaguars
– Martin taking the Under on the Bengals
– Sam taking the Under on the Jets
– Joe taking the Over on the Lions
– Sam taking the Over on the Dolphins (I guess he knows his own division well)

In terms of our group consensus predictions, we got correct:

– Ravens (under), Bills (under), Patriots (over), Steelers (over)
Got wrong:
– Panthers (over – yikes), Packers (over), Seahawks (over).
So as a team, we ended up 4-3. Not bad.
Now you have a few days to get your playoff prediction brackets to us. Significant others are also welcome as usual!
Here are the final tallies below.
Team Final Jake Joe Martin Alex Sam
Arizona Cardinals 7 0 1 0 0 0
Atlanta Falcons 11 0 1 0 1 0
Baltimore Ravens 8 1 1 1 1 1
Buffalo Bills 7 1 1 1 1 1
Carolina Panthers 6 0 0 0 0 0
Chicago Bears 3 1 1 1 1 0
Cincinnati Bengals 6 0 0 1 0 0
Cleveland Browns 1 1 0 1 1 1
Dallas Cowboys 13 0 0 1 0 1
Denver Broncos 9 0 0 0 0 0
Detroit Lions 9 0 1 0 0 0
Green Bay Packers 10 0 0 0 0 0
Houston Texans 9 0 0 0 1 1
Indianapolis Colts 8 0 1 0 1 1
Jacksonville Jaguars 3 1 0 0 0 0
Kansas City Chiefs 12 1 1 0 1 0
Los Angeles Rams 4 1 0 1 1 1
Miami Dolphins 10 0 0 0 0 1
Minnesota Vikings 8 0 0 0 0 0
New England Patriots 14 1 1 1 1 1
New Orleans Saints 7 1 1 0 0 0
New York Giants 11 0 1 1 0 0
New York Jets 5 0 0 0 0 1
Oakland Raiders 12 0 0 0 1 1
Philadelphia Eagles 7 1 0 0 0 1
Pittsburgh Steelers 11 1 1 1 1 1
San Diego Chargers 5 0 1 1 0 0
San Francisco 49ers 2 1 1 1 1 0
Seattle Seahawks 10 0 0 0 0 0
Tampa Bay Buccaneers 9 1 1 1 0 1
Tennessee Titans 9 0 1 0 1 0
Washington Redskins 8 1 0 1 1 1
Total 14 16 14 15 15

Poor form this year from myself.

That being said, I successfully picked the Cubs to win the World Series a few months ago, so perhaps my playoff predictions are my forte. Read it and weep chumps.

Playoffs Predictions!

AFC:
Wild Card:

Raiders @ TEXANS
God this game is going to suck. Brock Osweiler might be one of the worst QBs ever to play this much. They have something vague on defence though, and could take advantage of a few of Oakland’s O-line being banged up. I also just can’t take a rookie QB on the road in a playoff game in his first start.
Dolphins @ STEELERS
Not a big believer in the Dolphins, especially going into a cold Pittsburgh. The 3 Bs roll over the ‘phins.
Divisional Round:
Steelers @ CHIEFS
Big fan of what the Chiefs are putting together this year. Big Ben on the road is a different QB than at home, and by different I mean pretty damn bad. Chiefs shut down the Pittsburgh offense and Alex Smith does his boring, mediocre play enough to not throw it away.
Texans @ PATRIOTS
Texans suck. Patriots are good. Easy one.
AFC Championship:

CHIEFS @ Patriots

Andy Reid gets some sweet revenge over the Patriots for 2004. Patriots defence is pretty garbage this year and their all-white offence isn’t enough to get it done.
NFC
Wild Card:
Lions @ SEAHAWKS
Still don’t really know how the Lions made it this far. Staffdog has played alright with short throws but you need more than that doe. His broken hand can’t get it done over the Seahawks D and Wilson slings it to his boys for the W.
GIANTS @ Packers
Packers have a hot Rodgers, but McAdoo will cool him off with his Cheesecake Factory menu. Think the Giants D does enough, OBJ makes his standard 70 yard slant route TD and the Giants get a win to piss me off.
Divisional Round:
Seahawks @ FALCONS
Missing Earl Thomas, Seahawks defence just hasn’t been as good. Falcons and MVP Matty Ice are able to get things moving, while Vic Beasley wreaks some havoc against a porous Seattle O-line.
Giants @ COWBOYS
Hopefully both teams lose with a giant nuclear bomb exterminating them from history. In the case this doesn’t happen, Cowboys probably win the FuckingAsshole Bowl. They’re 0-2 against the Giants this season but I don’t seem them falling to 0-3 with this roster. Eli throws a few picks and does his Eli face.
NFC Championship
Falcons @ COWBOYS
Eagles were able to beat the Falcons by running the ball with Ryan Mathews over and over. Cowboys can do that but better with Elliott, so this doesn’t really turn into much of a contest.
Super Bowl
COWBOYS over Chiefs
First Brexit, then Trump, now the Cowboys win the Super Bowl to cap off what has been a shit year for my rooting interests. Andy Reid does some Andy Reid type coaching mistakes, calls some early timeouts, mismanages the clock and chokes it away in excruciating fashion. America’s Team win it all, go to the Trump White House and the world implodes.
Standard

Linear Drafting Is Bad And You Should Feel Bad

So linear drafting in fantasy football (and I’m sure you can extend this to baseball) vs snake. Martin’s complaint this year was that drafting early on in snake drafts disadvantages you because of the fact that you have to wait until pick 20, etc in order to get your next pick. Drafting late, was therefore some sort of advantage. This obviously goes to explain why myself and Joe always have the best teams because we end up around 1/2 every year then that gets translated into a 9/10 draft slot. It couldn’t have anything to do with the fact that I’m just good at fantasy football, the system MUST be rigged.
Anyway, anyone with two brain cells can tell that linear drafting is horrendous, as it allows the early drafters to get the pick of the bunch at every position across the board. While 8, 9, 10th drafters just get the dregs.
To try to get to the root of the question, it is necessary to figure out the value of each draft slot. Is 1 + 20 better/worse/equal to 10+11? And how much better is drafting 1 + 11 + 21, compared to 10 + 20 + 30? In a draft of 15 rounds x 10 teams = 150 picks, I don’t like the notion of counting back from 150 down to 1. Antonio Brown (1st pick = 150) is not equal in reality to Odell Beckham (149) + the 10th best DEF (1). There’s some sort of gap between them.
My idea then, was to use the auction values of each player to determine their worth and thus the value of each pick based on their ranking by price. You therefore get something like:
Player Average Price ($)
Antonio Brown 194
Odell Beckham 186
Julio Jones 178
Todd Gurley 170
Ezekiel Elliott 166
DeAndre Hopkins 158
David Johnson 154
AJ Green 154
Le’Veon Bell 150
Adrian Peterson 146
I averaged the price of players from a number of different websites in a 0.5 point PPR league where the budget to spend on players is $1000 to give more breadth.
I looked back over our Old Yellow Eyes league draft and added up the total ‘value’ for each team in the league:

oyelinear

The chart is quite revealing straight away. The first 3 teams to draft all managed to accrue more valuable players than the rest of the league. There’s some areas of differentiation (Thom having the worst draft despite having the 4th pick) but generally you can see a trend of declining returns the closer we get to Alex’s pick. Martin actually managed to broach the $1000 mark (1003), while Alex’s team was worth (768). That’s a 23.4% difference by the way. Comparing the average top 3 value to the last 3 average value, there’s a difference of 18.6%. So drafting in the bottom 3 in a linear draft, disadvantages you by roughly 20% compared to those at the top.
Alex and Joe were perhaps able to outperform your expectations due to better knowledge, but you’re simply not able to compete with those getting to draft earlier.
If we put the exact same picks into a snake draft, we get a different picture -keeping all the pick orders the same but assigning players to different teams depending on the slot – so if you had 10th and 20th originally, we’ve changed that here to 10th and 11th in a normal snake draft and assigned whoever was picked at 11th to your team instead. its therefore Fsnake on the chart because its a Fake Snake. As you can see its a lot more even and spread out and tells you that in a normal snake draft, the difference between drafting 2nd compared to 9th is far closer.
oyefsnake
Obviously one of the key differences is decision-making and what strategy one chooses to follow. In a world of perfect information, where everyone follows the same strategy and just drafts players based on auction value rankings, you’d end up with a distribution like this in a linear draft:
perfectlinear
Difference between highest and lowest is over $150 fake money. This basically implies that if you’re drafting last in a draft full of people with the same level of competency, you end up with a worse team no matter what.
Re-create the same ‘perfect’ draft in a snake format and the difference is much more spread out, with the gap between most and least valuable team at just $70 fake money.
perfectsnake
Again, Martin’s issue is that drafting early doesn’t give you any advantage. Well, in the second league I participate in, England vs America league, it happened to result in me getting the 1st overall pick in a normal snake draft and I consequently parlayed that into the most valuable team in the draft based on the same valuations as before.
Was that due to my draft position? Partly. It also happens that I’m good at fantasy sports and therefore, I pick better players.
evasnake
Standard

Over/Unders 2016 NFL

Bit late posting these but here we go for the start of the new season!

Team 2016 Wins Jake Joe Martin Alex Sam Consensus
Arizona Cardinals 9.5 Over Under Over Over Over
Atlanta Falcons 7.5 Under Over Under Over Under
Baltimore Ravens 8.5 Under Under Under Under Under Under
Buffalo Bills 8 Under Under Under Under Under Under
Carolina Panthers 10.5 Over Over Over Over Over Over
Chicago Bears 7.5 Under Under Under Under Over
Cincinnati Bengals 9.5 Over Over Under Over Over
Cleveland Browns 4.5 Under Over Under Under Under
Dallas Cowboys 8 Under Under Over Under Over
Denver Broncos 9 Under Over Over Under Under
Detroit Lions 7 Under Over Under Under Under
Green Bay Packers 10.5 Over Over Over Over Over Over
Houston Texans 8.5 Under Under Under Over Over
Indianapolis Colts 9.5 Over Under Over Under Under
Jacksonville Jaguars 7.5 Under Over Over Over Over
Kansas City Chiefs 9.5 Over Over Under Over Under
Los Angeles Rams 7.5 Under Over Under Under Under
Miami Dolphins 7 Under Under Under Under Over
Minnesota Vikings 8 Over Under Under Over Under
New England Patriots 10.5 Over Over Over Over Over Over
New Orleans Saints 7.5 Under Under Over Over Over
New York Giants 8 Under OVER Over Under Under
New York Jets 7.5 Over Over Over Over Under
Oakland Raiders 8.5 Under Under Under Over Over
Philadelphia Eagles 6.5 Over Under Under Under Over
Pittsburgh Steelers 10.5 Over Over Over Over Over Over
San Diego Chargers 7.5 Over Under Under Over Over
San Francisco 49ers 5.5 Under Under Under Under Over
Seattle Seahawks 10.5 Over Over Over Over Over Over
Tampa Bay Buccaneers 7.5 Over Over Over Under Over
Tennessee Titans 5.5 Under Over Under Over Under
Washington Redskins 7.5 Over Under Over Over Over
Over 15 17 15 18 19
Under 17 15 17 14 13
Standard

The Penalty Of Enduring Extra Time

Watching the Euros these past two weeks has been swell (England games aside). Had one of the finest weekends in a long time last week, when I watched football on my couch from 2pm to 10pm back-to-back Saturday and Sunday. Felt good to get back in touch with my roots.

Something I noticed is that it seems like games that go to Extra Time nearly always seem to end up going to Penalties. This makes sense, players are tired after 90 mins and they play more conservatively. Coaches likely coach more conservatively too. Its more ‘acceptable’ perhaps to lose in a penalty shootout than in Regular/Extra Time because its such a lottery. Think about how we viewed Hodgson after losing to Italy in Euro 2012 on penalties. For underdog teams it makes sense to sit back, put 10 men behind the ball and try your luck in a shootout. There’s probably a greater chance of an upset that way if they’re really not good enough to beat a favourite in open play. Its been griping me a bit because these Extra Time periods have been pretty dull and seem like a formality before a penalty shootout. Especially watching Portugal, who are awful.

I went through the recent history of World Cup, Euros, African Cup of Nations, Asia Cup, Champions League, Europa League/UEFA Cup and some domestic cup finals to figure out how often a game goes from Extra Time to Penalties. Analysed around 100 games tournaments/years and found around 300 extra time periods, results below (including current Euro 2016 data):

Extra Time

Penalties

AET

Penalties % Extra Time

Total

284

159

125

56.0

AET – means the match ended in Extra Time via someone scoring.

Golden Goal messes this up a little bit, so I’d put the percentage a bit more in the 60% region if I could go through and exclude those games from the sample. Weird research thing – Copa Libertadores (the Latin American version of the Champions League), Copa America (until recently) and Copa Sudamerica don’t even bother with Extra Time. They go straight to a penalty shootout after a tie in 90 mins.

Even so, I suppose 55-60% of games going into Penalties isn’t terrible.

Here’s the competition breakdown:

Penalty

So Copa America is a bit of an outlier because they’ve only had about 3 games with Extra Time, hence the high percentage. Europa League/Domestic Finals drag the overall down a bit as they’re in the 40s. For Domestic Cups, I looked at just Cup Finals from England, France, Germany, Italy and Spain. Other countries weren’t really sophisticated enough to include. Obviously I excluded the years where we used to just do replays.

In terms of whether this has increased/decreased over time…there’s nothing to suggest this. Its pretty random with up and down years and no discernible pattern. I think my conclusion would be that tournaments have expanded a lot more in the last 5 years, with more knock out rounds and thus more chances for a game to go to Extra Time/Penalties. So it just seems like it happens more often when I think as a percentage, its probably pretty consistent. I could probably go back and slice the data into different decades but I can’t be bothered at this point. Just take my word for it.

Anyway, I was hoping the figure would be higher – 75% or something, so that I could make an argument that the format needs to change. The 55-60% mark probably isn’t that bad and doesn’t represent an overall problem in the sport. I don’t particularly enjoy 30 min extra time periods where nothing happens and I’m not a huge fan of the lottery of penalties. Although it does make for one of the greatest spectacles in sports. I read something recently that said they should change the format, so you have penalties after 90mins, then play Extra time based on the score of the shootout. So 5-3 in Penalties means the losing side has to score 3 goals to win in the 30 min period. Would encourage some attacking play and not leave countries unfairly hating a single player for the rest of their lives…Gareth Southgate!

I’d support some sort of experiment – at least they tried in the past with Golden Goal/Silver Goal but it might need something more drastic.

Standard

Brexit Renders My Blog Useless

As if it wasn’t already…

Unfortunately, the result of Britain’s EU referendum has brought to my attention the fact that British people are now officially more stupid than Americans. Its been a point of pride, something we’ve held over our common tongue brethren for centuries but now our most favourite past time comes to an end.  This blog is founded on the very principle that English people know what’s best for Americans and American sports. The decision to leave the EU now means I have no claims to this superior knowledge anymore. We’re all idiots now.

There’s still a long way to go to reconcile with the atrocious decision that’s been made and politicians can talk about ‘uniting’ and ‘going forward together’ but the fact is that this is just bad for the country, bad for Europe and bad for the world. I must confess to barely even entertaining the idea that this would ever happen. Living in London and having social circles where everyone is voting Remain almost insulates you against the fact that anyone would vote for Leave. Polls were all in favour of Remain and when I went to sleep Thursday night, exit polls were projecting the Remain victory to be even larger than they had initially thought. So how on earth did we get here?!

Failure of Liberalism vs. Populism/Xenophobia
People are unhappy with the status quo. About 30 seconds after I read the first article on Friday morning declaring a Leave victory, my thoughts turned immediately to the US election and the similarities there. The level of inequality between London and the rest of the country, New York/LA/urban areas and the middle/South, the 1% and everyone else, are real issues and finding a solution to this problem is perhaps the single most important question of the immediate future. Polls had Remain comfortably ahead pretty much the whole campaign and the belief was that the Undecideds would vote for the status quo (staying in the EU), instead of the risky option of Leave. This proved to be false. People are so unhappy with their circumstances that they’d prefer to risk the current stability to ‘shake things up’. Whether or not I agree with their right to be unhappy, its clearly a massive problem and one that is rearing its head in the US.
The easy position is to blame immigration, free trade and weak/corrupt politicians for the mess and ‘taking back our country’ as the solution. Again, the rhetoric in the UK is the same as the US. The message that immigrants are stealing jobs and companies are outsourcing to China/India/Vietnam resonates and there needs to be a stronger counter-message to this line of thinking to stop the world going down a worrying path. An interesting anecdote, I was getting an Uber home recently and the driver had the radio on to a call-in talk show. A lady called in and did the usual rant about the government and then said “What we need in this country [the UK] is a strong leader like Donald Trump to fix things”. I asked the driver to turn off the radio and dismissed her out of hand as some lone nut job. Clearly, the politics Trump espouses resonates across the Atlantic, with white people feeling they are under attack.
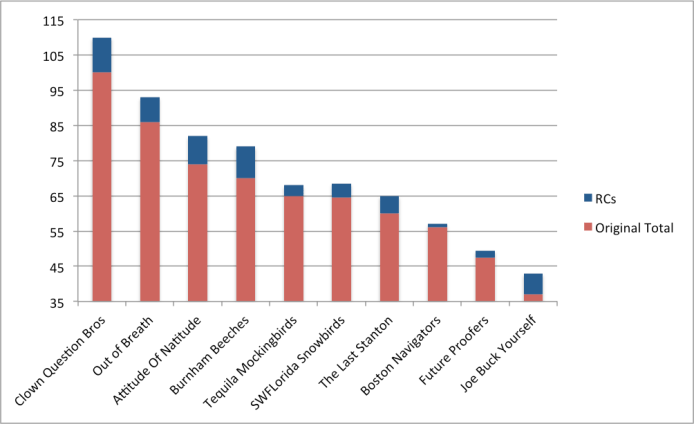
I’ve seen two charts that disturb me greatly. First, people who voted to Leave were from areas of the country that are most reliant on staying in the EU. The turkeys that voted for Thanksgiving. I imagine the same might be true of the US, in terms of free trade and globalisation and yet this message is not getting through.
We Are Living In A Post-Truth World
The problem with the pro-globalisation/pro-immigration argument is that people don’t seem to care about logical arguments, scientific data and ‘proof’. Its easier to blame a race of people than to explain that free trade lowers prices and makes us all better off. The main slogan for the Leave campaign said that ‘we send £350mn a week to Brussels and instead we’ll spend it on the NHS and social services”. Hours after Leave won, the leaders admitted this was a lie and that in fact, they wouldn’t be spending this ‘saved’ money on improving healthcare. A quote from Brexiter Iain Duncan Smith this morning about the Leave campaign promises: “Our promises were a series of possibilities”. The John Oliver clip you sent talks about the £350mn figure and debunks with some simple investigation. But people aren’t willing to actually look into these figures to see what they mean. Its like being back in high school where intellect and thinking, are mocked in favour of bigotry and catchy slogans.
A few weeks ago, Michael Gove, one of the key Leave politicians was asked about how he responds to claims from the World Bank, OECD, social scientists, academics, Barack Obama, researchers, economists, major international companies, etc that leaving the EU would be a terrible move for Britain. “People in this country have had enough of experts” he declared. We all laughed at him and his general inability to form a coherent argument in favour of Leaving, and it again strengthened the view that no one would listen to idiots like Gove, Boris Johnson, Nigel Farage and Donald Trump. And yet, how prescient that remark was and how it seems now. Trump can’t utter a single sentence without spewing a torrent of lies, conspiracy theories and misinformation. We have all these fact checking media outlets that brand him as a ‘liar liar pants on fire’ and it won’t ultimately matter because no one seems to care what is truth and what is not. Is it because there are too many facts, figures and opinions out there? Is it because people pick and choose the ones they want and fit them into their narrative? I lean towards this latter one, as it just seems like people have staked out their sides already and aren’t looking to be swayed one way or another.
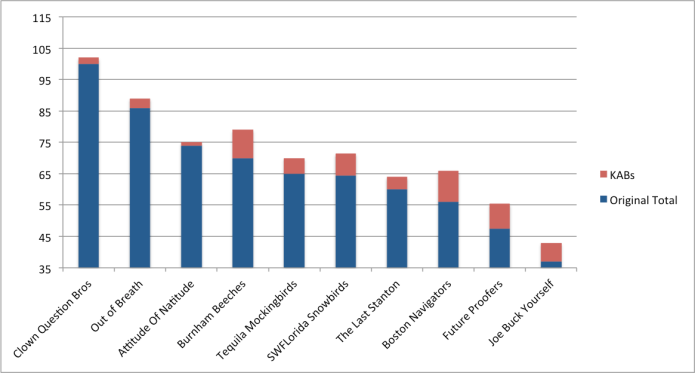
Second chart. This notes that if you had a tertiary degree you voted Remain, if you didn’t, you voted to Leave. I really don’t want to disparage people without University education as being less informed but there is clearly something to be said for using evidence based research and the scientific method that encourages people to look for data and scrutinise it when they find it.
Polarisation Means Things Aren’t Likely To Get Better
I’ve already touched on the Have’s vs. Have Nots, Educated vs Undereducated, Urban vs. Rural and Red vs. Blue but it probably bears repeating that these differences aren’t going to magically repair themselves. If you haven’t seen already, look at the UK voting results map. Northern Ireland, Scotland and London, major cities voted overwhelmingly to Remain, Wales and the rest of England to Leave. Its no wonder that people see politicians as weak when the level of polarisation is so high that we can’t compromise to get anything done. There’s joke petitions going around the Internet to request that London becomes an independent city state still a part of the EU. Or that it breaks away from England with Scotland and Northern Ireland to form ‘Remainia’. I thought the UK was generally less polarised than the US and it still might be but this was again, a big wake up call for me. How are we going to get back to a less polarised country? I have no idea. People on the Remain side are bemoaning Democracy as a whole, hoping for a 2nd Referendum or for the government to simply ignore the wishes of the majority. People on Leave want demagogues and ‘strong leaders’ to get things done. Seems like Democracy has just turned two sides against each other with little hope for reconciliation.
Lessons For The US
If Trump was more organised, better funded and had some semblance of control over his mouth, I would be expecting a Republican victory this November based on the Brexit decision. its been 48 hours so I’m probably still wracked with doom and gloom and maybe I’ll be more optimistic in the future but right now, things look really bad. Hillary is winning outright in a lot of polls and Trump keeps self-sabotaging but, we’re not in July yet, he has 4-5 months to get himself together and form a proper campaign infrastructure. Unfortunately, Hillary is an incredibly beatable candidate and he could easily be winning at this point. He won the Republican nomination months ago and could have spent that time crushing her. Luckily for us, he’s got 30 campaign staff and $1.3mn and doesn’t understand how to run a campaign. Anyway, point being that Hillary needs to think more about Polarisation, Populism and Post-Truth (the 3 Ps!) and come up with a way of convincing people outside of the traditional means.
Another critical point – Brexit was another failure of polling. As I mentioned, Remain was comfortably ahead most of the way and yet this happened. We can’t trust polling data gathered in traditional ways anymore: companies are still relying on randomised phone calls to a cross-section of the population. Instead, those conducted through the internet and smartphones are increasingly seen as more accurate, according to a couple of articles I was reading on it. In fact, online polls consistently put the Leave vote ahead by 1.2 percentage points, compared to live phone surveys that gave the Remain camp a 2.6 pps lead. The UK election last year was a massive shock to the polling community, as was the Republican primary along with a number of other polling failures in 2015. Its something I’ll take into consideration from now on when looking at the upcoming US election.
The point in all this being, I wouldn’t underestimate Trump and the grievances of his followers. There’s so much time for him to turn things around and simply dismissing his brand of populism, xenophobia and aversion to the truth is a huge mistake and a very dangerous attitude.
Standard

Go Back From Wentz You Came

I didn’t set out to create this blog to constantly cover Philadelphia stories but it just seems to be the case that so much is going on in the city every cycle. I promise to myself that I’ll do my best to look more nationally in the coming posts, just because the Eagles and Sixers’ seasons are over and there should be different stuff for me to write about. More crazy things can’t happen in Philadelphia, can it?!

Anyway, the Eagles made a big trade with the Cleveland Browns to move up to the #2 pick in the 1st round of the 2016 draft in order to draft a QB – Carson Wentz. In doing so, the Eagles gave up 5 picks, including a future 1st and a 2nd rounder in coming drafts. It came just days after I texted friends laughing at the LA Rams for doing the exact same thing with the Tennessee Titans, in order to get to #1. Leaving aside criticisms such as the fact that the top 2 prospects were not widely valued high, and how a QB-needy team (Cleveland) chose to roll with the QB Formerly Known As RG3 over picking Wentz, I want to focus on my issue with giving up 5 draft picks to what historically amounts to a 50/50 chance that the QB works out.

To be clear from the start, I have never watched Wentz play and have no real opinions about the fact he played at the FCS level. He could become the next Peyton Manning – Aaron Rodgers hybrid and I would still hate this decision. Giving up the farm is something that bad, desperate and short-sighted franchises do, to convince themselves they have a guy at QB and probably to sell more jerseys and hope to the fans. I’m also not a believer in Sam Bradford or Chase Daniel, though the latter intrigues me, probably because we’ve never seen him play – aka, backup QB syndrome. Even if Wentz turns into the best QB in the league there is no guarantee the Eagles win anything given what they gave up.

A lot of people around the world watched the Super Bowl this year. I would imagine that Eagles Owner Jeffrey Lurie, ex-GM/re-GM Howie Roseman and Head Coach Doug Pederson were three of the millions that did. If they did, they would have watched a 58 year old Quarterback who couldn’t throw a football more than 8 yards downfield and wouldn’t have enough mobility to run out of a burning building to save his own life. That QB won the Super Bowl off the back of his stellar defence. The old adage ‘Defence wins Championships’ proved itself to be correct once again. One study I tried to do for this blog, was to calculate the amount of salary that goes to QBs as a percentage of the cap. My belief is that paying your QB less, allows you to spend more on a depth on the rest of the roster and specifically defence. This is more important to winning a Super Bowl than ensuring you have the best QB in the NFL by spending 40% of your cap on his salary.

The Russell Wilson Seattle Seahawks and Joe Flacco’s Baltimore Ravens are two recent examples of QBs on rookie contracts who were able to win Super Bowls. Even looking at the New England Patriots last year with Tom Brady on a discount contract, which allowed them to go out and spend big bucks on Darrelle Revis. The Patriots defence won that Super Bowl too, rather than Brady. Even going back further seems to support this: New Orleans Saints had Brees on a reasonable contract, as did the Green Bay Packers when they won with Aaron Rodgers. Overpaying the QB is the worst decision a franchise can make and its one of the reasons why I believe the Ravens will never win another one as long as they are paying Flacco huge money.

Coming back to the Eagles, they’re nowhere near giving up that kind of salary to a QB, so trading up for a QB isn’t a major problem on the surface. The problem is that the rest of the team is nowhere near ready to be able to compete. We currently have one Pro-Bowl calibre player on the roster: Fletcher Cox. The rest is largely unproven and we have a brand new Defensive Co-ordinator in Jim Schwartz. There’s a few other ‘good’ players on the roster but even with Schwartz’s recent success, this isn’t a world-beater. When you trade picks away, you lose the ability to get some difference makers and now there won’t be any coming until 2018. The timeline looks something like:

2016-17: This year will be awful. Transition from 3-4 Defence to 4-3 Defence. Wentz sits to ‘learn’ from Bradford, who does his normal below average play and probably gets hurt somewhere along the line. Maybe 1 other player from the late rounds emerges as a starter.

2017-18: No 1st rd pick, Bradford leaves, Wentz becomes the man in his redshirt rookie season. Throwing to Agholor who might not be good, Matthews who drops stuff all the time and Ertz. Ooh Wentz-Ertz has a kind of ring to it. Hope to get something out of the 2nd rd pick.

2018-19: Finally a 1st rd pick. But they’re a rookie and can’t be expected to transform the franchise in one season. No 2nd rd pick. Year 2 for Wentz, takes a step forward hopefully.

At this point, we’re 3 years in and I’d say there’s a chance we haven’t made the playoffs once yet. Is Pederson the Head Coach still? Kelly lasted just 3 years even with a good record.

2019-20: Wentz is in Year 3 but actually Year 4 of his contract, so you have to start thinking about offering him a new deal with his 5th and final year next year. In terms of roster, we’ve added one 1st rd and one 2nd rd since 2016. That’s insane. Cox turns 29 this year, is he still the same player? Is he on the team? Injuries taken their toll? Need to be making the playoffs at this point.

2020-21: This is your last year before you pay Wentz and thus the last year to load up on roster depth and defensive quality to challenge for a Super Bowl. Except you’ve had no high draft picks in years. Its already too late because the team isn’t good enough.

You give Wentz $30mn a year in the offseason and there goes your chance to win because he takes up too much of the cap.

That’s my timeline of despair. Instead, you gather as many picks as you can to build up the best possible roster. Get two 1sts or 2nds to spend on quality elsewhere, then add the QB on top. It matters less who he is, just that the roster is good. Add him in Year 3 of that timeline and suddenly you have a stronger roster that can compete straight away. Instead, the Eagles made the wrong decision and doomed the team for the next 5 years. Thanks.


Standard