
Since I managed to lose the top spot in both our leagues and end up 2nd, I’m pretty annoyed about the whole thing and endeavoured to further investigate the cause behind it. One thing you can find on ESPN is the Active Stats count, which shows historically every player you’ve put into your line-up and contributed to your team even if its only 4 at bats or pitched 1 inning. Using this info you can determine just how many at bats your team has had over the course of the season and how many total pitched innings.
Comparing each team in both leagues, one trend becomes pretty clear. Looking at SOP first, FOW (I Hate Drew Storen) clearly outperforms in both number of At Bats and number of Innings Pitched during the course of the season. Around 500 at bats more than our 3 teams. Of course, in a league where you add up Runs, HRs, RBIs, Ks, Ws, SVs, BBs and QS, the more AB and IP, means more opportunities for additional counting stats. The only potential issue is that the more AB and IP could be bad for the 3 ratio stats: AVG, ERA and WHIP.

The same is also basically true for Mayberry. PARK had the most AB and pretty much the most IP also (only narrowly 2nd to GG). Both PARK and FOW ended up with essentially 10s across the board in Runs, HR, RBIs and Ws giving them a great advantage.

So how exactly do they achieve this? Well the also both had the most Activations over the course of the year. ESPN doesn’t give a great definition of what it actually means by Activations but I assume it refers to assuring you always move bench players into your active lineup. I assume we all do this anyway but I guess there are times when we might forget or not start players who are slumping. Its not necessarily the case that more Moves (Adding/Dropping players from Free Agency) is a factor because the data show different results for both the leagues – although it might be something to do with the different structure and bench sizes. Looking at Mayberry first, PARK had the most Activations and also made the most Moves. So I guess as often as he could, he plugged in any free spaces with guys off the wire (although I didn’t specifically notice this happening). However, this isn’t the case with SOP, as FOW is behind a number of other teams in terms of Moves, although Activations certainly are the highest. Must be something to do with the larger bench size makes it easier to plug in empty slots without dipping into the free agent pool.

I’m not totally convinced by the explanation, particularly as I’m still unclear on what Activations are, but it seems like the most logical conclusion.
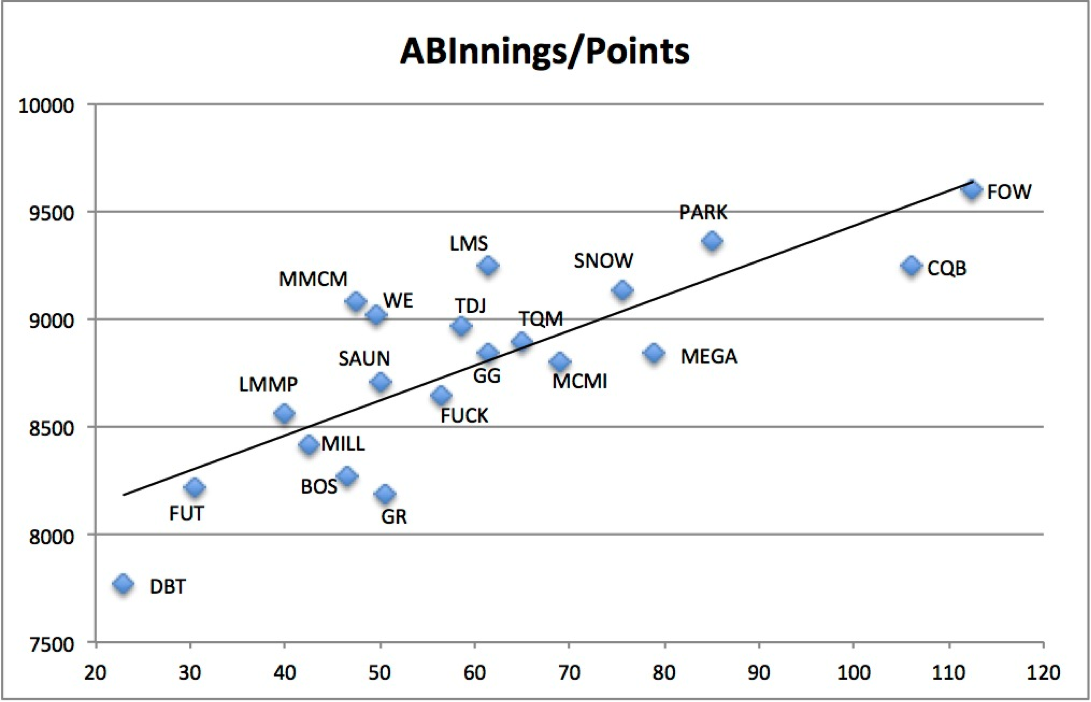
If you need some further evidence on the correlation between number of AB and IP to total points gained over the course of the season, I’ve put this chart together. Here, I combined the total AB and IP to create an ABInnings stat and plotted it against the final points standing in the table. As you can see, there’s a fairly strong link between the two. CQB is a bit of an outlier but that’s mostly because the total points available in SOP was higher and more ABInnings were recorded on average over Mayberry. Otherwise it makes for a fairly nice correlation.
So why did I go through all this effort? Basically to prove that while I may not have come 1st in the league, I had the most efficient team in both leagues and the better talent overall. I had less runs in fewer at bats, but as a percentage, this was higher than the likes of FOW and PARK. My team was gaining more runs/HRs/RBIs/SB per at bat, and more Ks, Ws and SVs per inning pitched. The only reason I lost was because they just abused the lack of limits on innings and at bats to sneak in more.
Instead I calculated the number of at bats and innings it took to earn each counting stat and from there, assigned rankings 1-10 based on who was more efficient. So for example, it took me 25.7 at bats to earn 1 HR. It took FOW 26.7 at bats to earn 1 HR, so my lower number means I was the more efficient and thus had better talent on my roster. From these line charts, you can see that not a huge amount has changed but in both leagues it would have shifted some position finishes. Most importantly though, I would have won both leagues if I’d supplemented my daily lineups with some scraps in the free agency pool.
I’m MEGA in Mayberry:

And CQB in SOP:

Hopefully we’ve learned some things for next season but I think there must be a broader tactic underlying both PARK and FOW strategy. I’m yet to totally figure it out but I imagine it has something to do with the way they stagger their pitching and batting throughout the year. Contrary to my tactic this year, it might make sense to rush through your 200 pitching starts as quickly as possible and replace as many as possible with relievers, while using your bench and any additional slots to stack batters every day for the second half of the season. Might explain how PARK came out of nowhere over the last few months to overtake me for 1st. Strange thing is though that neither FOW or PARK reached their game start limits with a lot of time to spare. So I’ve essentially hit a wall when it comes to figuring out the best way to take advantage of this tactic.
