
It is hard to know where to start with the analysis for this company. On the one hand is a recently legalised industry that is in its infancy, but still with massive potential for growth as new states and new users experiment with online gambling. On the other hand, the industry is still recovering from COVID-19 and the impact it has had on the sports industry. The share price has already surged and fallen back, as well as growing net losses.
Realistically, it should have been at the bottom of its value the last six months with no actual sports taking place to gamble on but we don’t really live in that world anymore. It’s inarguable that the market for sports gambling has plenty more room to run. The decision by the Supreme Court in 2018 opened up the potential for sports betting to take off around the country, with many states taking the plunge. 15 States plus D.C. and Puerto Rico have authorized online/mobile functionality, with another 7 allowing for sports betting at retail locations.
The total population within these states is roughly 137m according to Census Bureau population estimates for 2019, out of a total US population of 331m. There’s approximately 200m more people to expand this market to cover although obviously, that doesn’t strip out the under 18 year olds who wouldn’t be allowed to gamble. It should still serve as a benchmark in terms of how much more the market could potentially grow. Sports betting legalization enjoys strong public support with 63% approving of the Supreme Court’s decision and 8-in-10 people support legalizing gambling in their state, according to a 2019 study by the American Gaming Association.
| Online | Land | Population |
| Arkansas | 3m | |
| Colorado | Colorado | 5.8m |
| Delaware | 0.97 | |
| Illinois | Illinois | 12.7m |
| Indiana | Indiana | 6.7m |
| Iowa | Iowa | 3.2m |
| Michigan | Michigan | 10m |
| Mississippi | 3m | |
| Montana | 1.1m | |
| Nevada | Nevada | 3.1m |
| New Hampshire | New Hampshire | 1.4m |
| New Jersey | New Jersey | 8.9m |
| New York | 19.5m | |
| North Carolina | 10.5m | |
| Oregon | Oregon | 4.2m |
| Pennsylvania | Pennsylvania | 12.8m |
| Rhode Island | Rhode Island | 1.1m |
| Tennessee | 6.8m | |
| Virginia | 8.5m | |
| Washington | 7.6m | |
| West Virginia | West Virginia | 1.8m |
| DC | DC | 0.7 |
| Puerto Rico | Puerto Rico | 3.2m |
| 90.9m | 121.27m | 136.57m |
Now that sports have returned in close to their full capacity, the same should also be true of expenditures towards betting on the games. DraftKing’s Q3 2020 results shed some light on the past year and the toll it took on the industry. On a quarterly basis, the company previously saw a peak in revenues in Q419, with estimated revenues of $131m. According to the company’s earning transcripts, its Q1 2020 revenue was up by 60% year-on-year prior to March 11, 2020 due to its launch of its sportsbook offering in Indiana, New Hampshire, Pennsylvania and West Virginia in the third and fourth quarters of 2019, and Iowa in the first quarter of 2020.
From mid-March 2020, revenue declined due to the suspension and cancellation of sports seasons and sporting events. This led to a dropoff in users, engagement and spending on the platform as a result. By Q3 2020, the NBA, NFL and other sports had returned, which led to revenue for the quarter of $132.8m, higher than its previous peak in Q419. However, the loss of revenue over a large part of the year led to widening net losses as the company spent but had very little coming in. DraftKings recorded a net loss of $347m in Q3 2020, its largest single quarter loss by far.

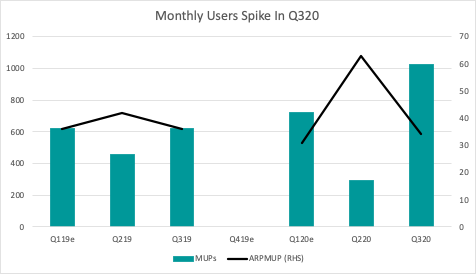
The latest results for its monthly users and spend on a per user basis are also encouraging in their Q3 2020 results. The company defines its Monthly Unique Payers (MUPs) metric as “the number of unique paid users (“payers”) per month who had a paid engagement (i.e., participated in a real-money DFS contest, sports betting or casino game) across one or more of our product offerings via our platform.” Participating in an actual ‘engagement’, ie. placing a bet is seemingly good measure of payers and they note that they exclude people who have money deposited but haven’t placed a bet. When it comes to company specific metrics, this seems like a reasonable definition which is not always the case. As a follow-on, they also have an Average Revenue per MUP (ARPMUP) metric, defined as “the average monthly revenue for a reporting period, divided by MUPs (i.e., the average number of unique payers) for the same period.”
The company passed 1mn monthly users in Q3 for the first time, as sports started and pent-up demand brought people back to the platform. Not surprising that average monthly spend would drop from a high of $63 to $34 as the more dedicated users gives way to casual users spending a lower amount to bring down that average. Growing this number moving forward will be important to sustaining revenue growth. $34 ARPMUP is just below the $39 average in 2019 but with NBA set to return in Q4 and into Q1 2021 alongside the NFL, I would expect to see a strong two quarters for the company.
DraftKings and its competitors also offers a range of other non-sports related gambling offerings within its app. It lists these all under the ‘online gaming’ business line but outside of its sportsbook, it also offers daily fantasy sports (DFS) and iGaming, which is an online version of games found in traditional casinos, such as blackjack, roulette and slot machines. Its unclear which of these three are the largest contributors to this segment. DFS has been the company’s historic focus, iGaming may be more consistent but my guess would be that the sportsbook brings in the most revenue.
This is more apparent when you look at DraftKings’ closest competitor in the market, Flutter Entertainment, and its breakdown of revenues by activity. Flutter is a bookmaking holding company formed of the merger between Paddy Power and Betfair, before it also acquired The Stars Group. In 2019, it agreed to acquire FanDuel in the US, historically DraftKings largest competitor. Flutter is now the largest bookmaking company in the world with a market cap of $27b. Because it is formed from companies in the UK and Australia, two countries where online sports betting as been legal for years, it provides a glimpse into the future of the industry.
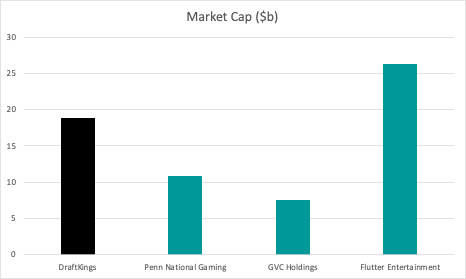
For example, the total North American gaming industry was estimated to generate approximately $134 billion in annual gross gaming revenue in 2019, according to H2 only 5% of which was derived from online gaming. When compared to other developed markets such as the UK, H2 estimates that more than 45% of the U.K.’s gross gaming revenue comes from online betting. This demonstrates the growth potential of the US market as more states open up and allow online transactions. DraftKings already has a market capitalisation of close to $19b and would be lucky to see sales of $500m for 2020. There’s plenty of room for growth but much of it seems priced in already.
Notably, you can see from the breakdown of Flutter’s revenues that sports bookmaking is the largest single contributor to its business, across different countries, brands and overall, contributing around 60% over 2019 and 2020. Its ‘US’ business line is specific to FanDuel, where it has retained its branding. Given that sporting revenue represents about 60% of its business for FanDuel, the same is likely true for DraftKings too.

Competition in this area of the market is intense and barriers to entry are relatively low. Establishing itself as a top brand in the space is helpful but looking again at the UK market for example, there have consistently been a large number of players in the space with new entrants from overseas trying to garner their own slice. The mergers under Flutter have helped reduce the number of companies in the space but there remains other well-established brands in the UK market, including GVC Holdings now Entain (Bwin, Coral, Ladbrokes), Bet365, William Hill, Betfred, Kindred Group and 888 Holdings. At a certain point, there is little to choose between the platforms, offering similar technologies, betting events and promotions. Gaining an upper hand comes from aggressive marketing and giveaways and doesn’t guarantee ‘stickiness’ to one platform in particular.
Any new innovation, for example, in-game betting and ability to cash out on winnings early, can be copied relatively quickly by the competition. In developed markets, user acquisition is therefore almost entirely based on a zero-sum game of poaching users. The immaturity of the US market means that the company does have some scope to push into new players but this will inevitably run out of rope. DraftKings reports that its sales and marketing expenses grow by 27.3% between 2018 and 2019, reaching $185.3m, accounting for 57.3% of its revenue in 2019. The company did go on to say that it had recouped approximately 90% of its 12 month marketing spend, however.
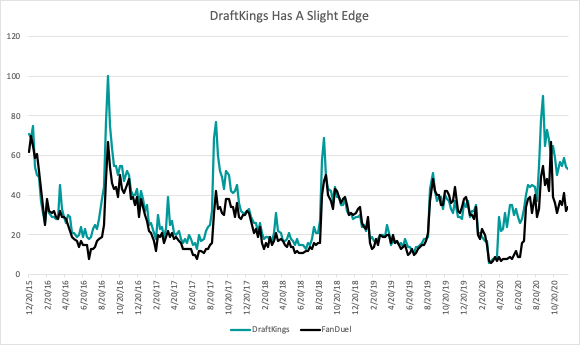
DraftKings also reported that is has over 4.3m cumulative unique paid users, which means it needs to convert about 3.3m of these into its monthly paying users. The company claims to have a 60% market share of the online gambling market, so the top player ahead of FanDuel. This tracks with search trend data from Google Trends, which tends to show DraftKings as the more popular search term ahead of FanDuel. This is particularly true during the seasonal spikes towards the end of the year and likely spilling over to the end of the NFL season.
It has the advantage for now, although arguably FanDuel is backed by an entity with greater financial resources to potentially outspend the company in the future. Capitalising in the short-term where there is still organic growth to be had has probably led to the spike in the company’s share price during this period. However, when new states run dry, the intensity in competition will result in higher acquisition costs as DraftKings and its rivals look to poach from each other.
