
Just before the start of our baseball Keeper league draft, our Commissioner proposed adding a new category for the season, called Runs Created. We’re also adding Holds as a pitching category but we can’t perform this exercise with that. I prepared a whole analysis explaining why it would be a not-so-great idea to add this particular stat, with my intention to lobby for Batter Ks instead. However, in the time it took to prepare this, the league decided against it and went with Total Bases as a category instead, which meant the amount of time I spent on this was all a waste. Oh well.
Using the fairly limited resources at my disposal, I tried my best to replicate the previous season with the addition of a Runs Created and a Batters Ks statistic. The challenge is that no team uses a roster of 20 batters only throughout the year but constantly brings in new players who contribute their stats for 1-159 games and all this must be accounted for. ESPN doesn’t provide a list of how many K’s or doubles or triples your team had last year, which obviously would make the process that much easier. It does provide the end of year stats for individual players and how many games/ABs they contributed towards your team score.
So for Runs Created, I used the ABs a player contributed to your specific team x their 2016 OBP and their 2016 SLG and added it to .55 of their SBs, which is about as close as we can get. This has the obvious limitations of not accounting for if you played Chris Davis for 20 ABs and he went 20/20 in your lineup or 0/20, it just uses his final averages for the year for those 20 ABs. Not much I can do about that.
So here is what roughly the total Runs Created would have looked like for each of the teams in our league last year:

As you can see from the chart above, the top 4 finishing teams in the league last year (CQB, OOB, AoN and BB) all finished in the top 4 in Runs Created. My 1st place team, also finished 1st in creating runs. I suppose its not a massive surprise that the best teams finished with the better Runs Created score. If we remove all the pitching categories from our final score to get a “Offense Only” score total (adding up the score for the 5 categories), it looks fairly similar to the Runs Created stat:
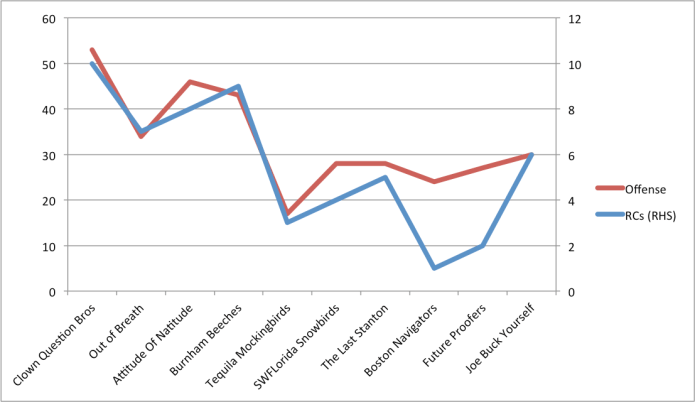
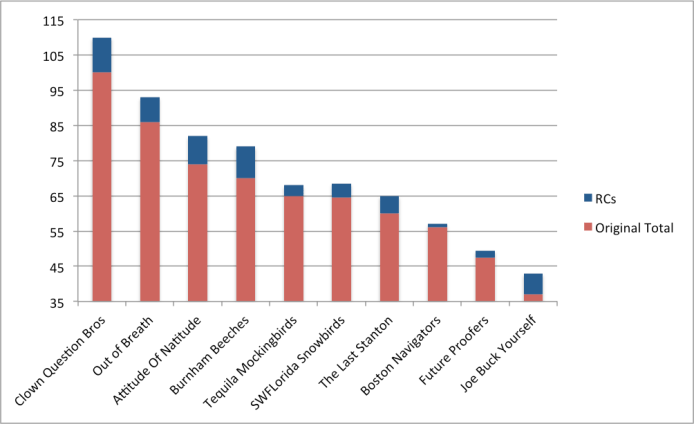
What am I trying to say here? Essentially that the addition of Runs Created would largely reinforce the scores of teams who already have good offenses and punish those without, widening the gap between the top 4 teams and the rest of the league. My batters consist of Trout, Machado, Rizzo, Lindor, JD Martinez, Myers, Chris Davis and a whole lot more, so I’m likely to continue reaping the benefits of a system that rewards a Runs Created batting category. There’s a lot of overlap with existing categories and it wouldn’t do a lot to shake things up as you can see from the chart below, which shows the original final scores with the addition of the RC category on top. The major difference is that SWFL overtakes TQM for the 5th spot.
What I looked at as an alternative is adding a Ks category for batting. Every time one of your guys strikes out, he gets a K and the person with the most Ks gets the lowest score (1) while teams who strike out less get higher scores.
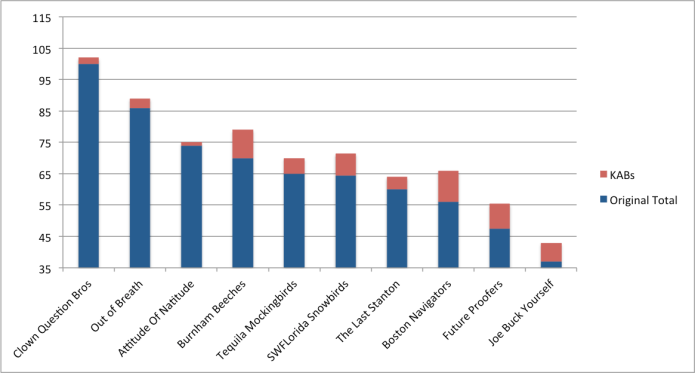
Again, ESPN doesn’t provide a Ks total for your specific team so I had to do some creative calculations to get a rough approximation. I used the At Bats of every player who ever swung for your team, divided by their total At Bats for the season to create a percentage of how much they contributed. I then multiplied their total Ks for the year by this percentage to get a rough estimate of how many Ks they contributed to your team. Adding up all those estimated Ks gives us the following totals.

A bit more widespread than with the Runs Created but it does vaguely seem like the top teams have more Ks, then the middle bunch, then the last three teams with the least. As I mentioned before, the fact that the top 3 teams have the most Ks works as a benefit for the rest of the league as CQB gets 2 points, OOB gets 3 points and Attitude gets 1 point for this category, whereas teams like Boston gets the full 10 points and Future Proofers 8 points. This would actually help shake the final standings up a great deal:
From what I can tell, there isn’t a great deal of overlap between Ks and AVG, so it adds a new dynamic to the game.
The downside to this is that it does reward teams who may lose interest as the season goes on and don’t move active players into their lineups every day. It can make it impossible to get 10 points if one of the managers stops checking or doesn’t play as often.
