
This year I embarked on a passion project that I’d been contemplating for some time but never had the patience to pull off. As you know, each day the point rankings get updated to reflect the latest daily point totals and who has moved up or down the table. What I’ve always wanted to do was to track those point totals throughout the season and play around with the data at the end. ESPN doesn’t allow you to go back and look at the table for June 28th 2015 (as an example), so unfortunately there’s no easy way of accessing this historical data. The only solution is to set up your own spreadsheet and manually enter the figures in every day of the season for 162 days.
Well, you’ll be pleased to know that I actually carried out this painstaking task for some unknown reason – just so I could write this blog post at the end of the season! I should point out quickly that I missed a few days by accident (approx 7 days) along the way, but these are interspersed throughout the year and don’t impact the overall trend. In this situation, I merely calculated the average for the two days either side to fill in the blanks. Forgive me my occasional holidays away from the internet, hangovers or excessive real work demands as the year went on.
Anyway, there’s little in terms of actual analysis you can really perform on the data, it’s more to create some nice charts that show how the year played out. So enjoy!
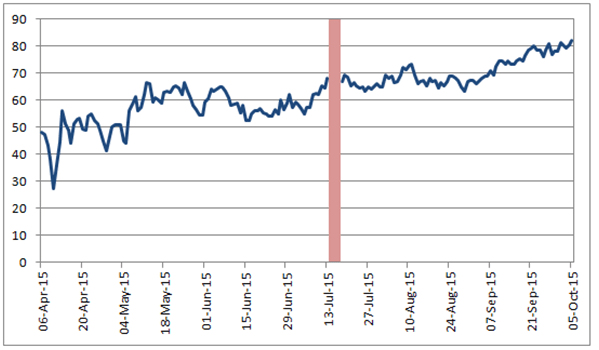
Points Tracking
As you can see from this chart, the first team to occupy 1st place in our standings was Last Man Stanton. Those early days see lots of volatility as a big day can propel you from 10th to 1st. As early as mid-May, the top 3 teams had begun to separate themselves, and managed to hold that advantage all the way to the end of the year. Were these teams better managed? Suffer less injuries? Had better players to start with? Perhaps a combination? It’s not entirely clear but it could be the case in our league that the larger benches make it easier to horde players throughout the season and there are fewer ‘gems’ to be found in free agency on a daily basis. Perhaps places greater emphasis on drafting a good team to start with (as well as having superior Keepers). I wouldn’t entirely discount dumb luck though, as that always helps!

SWFlorida Snowbirds fell away from the top two just after the All-Star Break and began a slow and steady decline. Still, a great performance from one of the newcomers this year! The battle at the top between myself and I Hate Drew Storen raged on until the last day though I was unable to really challenge him in August/September.
The really exciting battle looked to be between 4th, 5th and 6th place (Tequila Mockingbirds, Last Man Stanton and Out Of Options). Tequila Mockingbirds secured 4th in the end even though Out Of Options had generally held it down for the longer amount of time over the course of the year. Out of Options even dropped down to 6th right at the finish line by Last Man Stanton following a late surge.
There was a slightly similar dogfight among the 7th-9th place teams, which really intensified in September. Huge September surge from Joe Buck Yourself…he plays for October. Burnham Beeches managed to drag himself from last place in the first half of the year to finish in a more respectable position. Boston Navigators was one of the steadiest performers throughout the year, perhaps some high risk/high reward strategy is needed next year? Speaking of high risk strategies, it didn’t pay off for Future Proofers this year, however, with a nucleus of Kris Bryant (Rookie of the Year), Joc Pederson, Starling Marte and Lorenzo Cain, he’s found a couple of high upside picks that could form a formidable team in the future.
As we can see from the graph though, I Hate Drew Storen was certainly a worthy Champion, with prolonged stints at the top and didn’t drop below 2nd place after May!
Variance
Variance is a calculation of the points spread between the highest scoring team and the lowest scoring team on any given day. Interesting to note the trend here, that the gap between 1st place and 10th place kept widening as the season went on. Obviously the gap is smaller at the beginning when we all start on the same number of points but from August to October the gap grew rapidly. I thought there might be a chance that the variance would tighten up at the end of the year as players were rested and playoff positions secured but this didn’t play out.
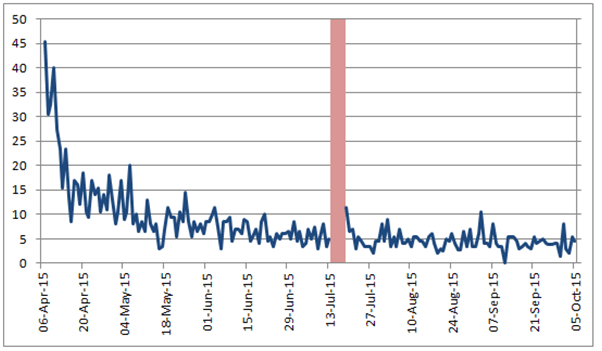
Volatility
The trend towards greater variance between 1st and 10th as the season progresses is also evident in the volatility of point movement up and down the table. Here, I calculated the difference between the largest daily movement and the smallest daily movement to denote the level of volatility. As you can see, it really slows down as the season goes along. This makes sense, teams manage to stretch out their leads in various categories, widening the gap and making it difficult to overtake other teams. I Hate Drew Storen had a lead of over 100 Runs over me, and so was easily going to hang on to the 10 points in that category. The relationship between Volatility and Variance over the year is quite apparent therefore.
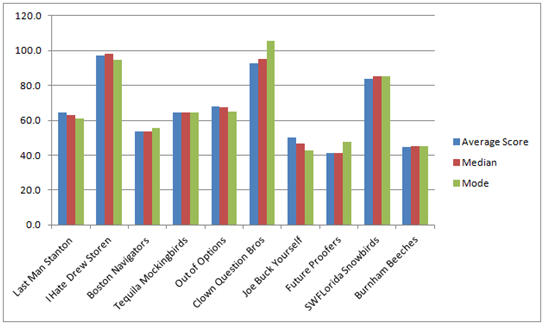
Point Averages
I also looked into various averages for the year, beyond the most widely used. My Mode score of 105.5 was the highest in the league, so I’ll count that as a minor victory in order to console myself from coming in 2nd. Mostly though, you can see some of the points trends I mentioned in my initial write-up on the chart below. For example, on average, Out Of Options was arguably more deserving of 4th place than Tequila Mockingbirds, even though the end of year standings say something different!
Position Data
The data for who occupied which position makes for less attractive charts than pure points, so I’ve compiled it into a table. As you can see from my average position of 2.2, my median position of 2nd and my mode position of 2nd – it seems clear I fully deserved my 2nd place (and not 1st).
There’s also some fun calculations in there such as how many days each team spent in first and last. Tequila Mockingbirds and Future Proofers unfortunately never had the honour of occupying 1st place during the season. Outside of the top 3 finishers, Burnham Beeches was the only team to hold 1st place for more than one day.
| Average Position | Median Position | Mode Position | Best Position | Worst Position | Days Spent In 1st | Days Spent In 10th | |
| Last Man Stanton | 5.4 | 6 | 6 | 1 | 10 | 1 | 1 |
| I Hate Drew Storen | 1.5 | 1 | 1 | 1 | 9 | 110 | 0 |
| Boston Navigators | 7.2 | 7 | 7 | 1 | 9 | 1 | 0 |
| Tequila Mockingbirds | 5.2 | 5 | 4 | 3 | 9 | 0 | 0 |
| Out of Options | 4.5 | 4 | 4 | 1 | 9 | 1 | 0 |
| Clown Question Bros | 2.2 | 2 | 2 | 1 | 6 | 47 | 0 |
| Joe Buck Yourself | 7.9 | 9 | 9 | 1 | 10 | 1 | 15 |
| Future Proofers | 9.1 | 9 | 10 | 5 | 10 | 0 | 83 |
| SWFLorida Snowbirds | 3.0 | 3 | 3 | 1 | 10 | 18 | 2 |
| Burnham Beeches | 8.7 | 9 | 10 | 1 | 10 | 2 | 72 |
The highest points score recorded this season was 112.5 by I Hate Drew Storen, actually recorded on the last day of the season. The lowest was Future Proofer’s 28 points from October 1st. The mode for the year was 65. Phew, that’s a lot of work!

